Analytics
Every panel on yieldbasis.com/analytics traces back to a specific contract state variable or a derived metric. This page maps each panel to its source and flags the common misreadings.
If a panel label or layout has changed since this doc was written, the code-level source (contract or subgraph field) is still authoritative. Panel labels are quoted exactly as they appear in the UI.
The dashboard has four top-level tabs plus a per-market detail view.
Tab: Markets
Protocol-wide view of all YB markets.
Top metrics
| Label | What it is | Source |
|---|---|---|
| TVL | Sum of LT vault values across all markets, in USD | Aggregated LT.liquidity.total × oracle price |
| Collected admin fees | Cumulative admin fees already claimed via withdraw_admin_fees and routed to FeeDistributor | Subgraph event log |
| Pending admin fees | Admin-fee balance not yet withdrawn | LT.liquidity.admin (positive part) per market, summed |
Admin fees are the protocol's cut of yield, split per the staking ratio. See Fee Mechanics.
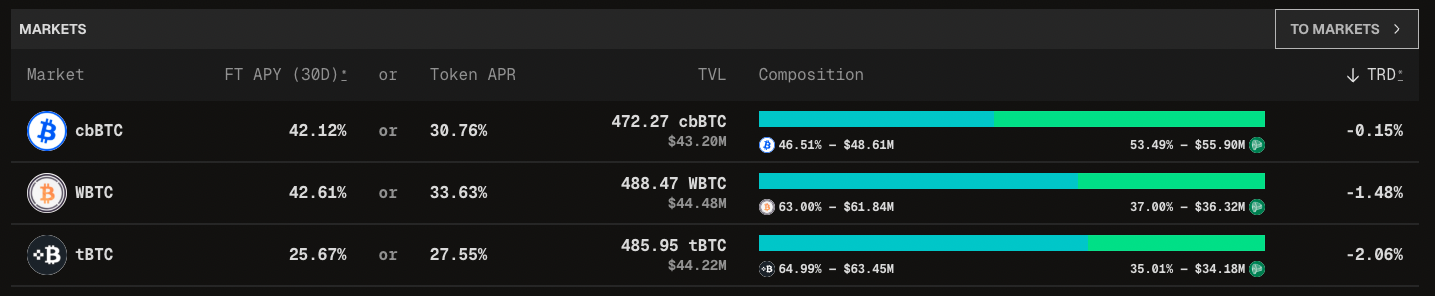
Markets table
| Column | Meaning | Notes |
|---|---|---|
| Market | Asset symbol; Deprecated badge for legacy LTs | Legacy markets have withdrawal open but no new deposits |
| FT APY (30D) | Fundamental trading APY, trailing 30 days | Derived from PPS (fundamental-value) growth driven by trading fees. Does NOT include emissions. |
| Token APR | Gauge emission APR at current rate + vote weight | YB-denominated at current YB/USD |
| TVL | Vault value in asset quantity + USD | |
| Composition | Cryptoswap pool balances (asset vs crvUSD) | Reflects Cryptoswap internal state, not LT |
| TRD | Temporary Redemption Discount % (signed) | preview_withdraw(1e18) / pricePerShare() − 1. Negative during a discount (e.g. −1.5% on a drawdown); positive in the rare premium case. Resolves via arb; see TRD |
The tooltip on TRD says: "Pools may become imbalanced during high volatility, causing redemption discounts. Arbitrage and swaps naturally rebalance them with time, reducing the discount to 0." The Cryptoswap pool rebalances its price_scale internally (fee-funded), and VirtualPool arbitrage closes the LEVAMM-vs-Cryptoswap gap.
PPS charts (plain — unstaked path)
- Fundamental PPS (PLAIN) — PPS-equivalent series if a share were held unstaked. Tracks value growth from fees.
- Redemption PPS (PLAIN) — What you'd receive on
preview_withdrawat each point in time. The gap to Fundamental PPS is realized TRD.
PPS charts (staked — with emissions)
- Fundamental PPS (STAKED + EMISSIONS) — Staked-side value per share (subject to watermark, not unstaked PPS) plus accrued YB emissions priced at YB/USD. The two components are summed for display.
- Redemption PPS (STAKED + EMISSIONS) — Withdrawal value for a staked share including accrued emissions.
A gap between these two on the staked charts indicates watermark shortfall (staked < ideal_staked); see Watermark and Recovery.
These staked charts include emissions in their value line. That is how the dashboard makes a like-for-like visual comparison with the unstaked (plain) charts. Do not interpret the staked line as "staked earns PPS growth" — staked positions do not accrue unstaked PPS. The apparent growth in these charts is the emissions component. Your realised return as a staker is emissions-only; comparing to unstaked means comparing emissions-to-you against unstaked PPS growth, not summing them.
APY / APR charts
- Trading APY — Fundamental trading APY over a selectable window (default ALL-TIME). 0% baseline included so you can see underperformance periods.
- Token APR — Gauge emission APR, bounded at 0.
Admin fees charts
- Total Collected Admin Fees (USD) — Area chart of cumulative protocol-wide admin fees since genesis.
- Collected Admin Fees by Market (USD) — Per-market breakdown. Helpful for spotting which markets contribute most revenue.
Tab: Gauges
Governance-adjusted emission routing.
Top metrics
| Label | What it is |
|---|---|
| Total veYB votes | Total veYB currently in the system |
| Total gauge votes | Sum of veYB weight allocated to gauges (≤ total veYB) |
| veYB Vote Utilization | total gauge votes / total veYB — fraction of veYB actively voting |
| Total YB Emissions | Cumulative YB minted to gauges |
| Daily YB Emissions | Projected 24h emission at current schedule |
| Votes per YB/day | veYB required to direct 1 YB/day to a gauge |
The tooltip on "Votes per YB/day" is the practical unit for gauge-vote strategy.
Gauges table
| Column | Meaning | Source |
|---|---|---|
| Gauge | Gauge's market asset | LiquidityGauge.lt → LT asset |
| Staked % | Fraction of that market's LT staked in the gauge | staked / total_supply on LT |
| Votes | veYB allocated to this gauge | GaugeController.gauge_weight |
| Vote weight | This gauge's votes / total gauge votes | Derived |
| Incentives weight | Emission share, vote_weight × sqrt(staked/total) | See Gauges & Emissions |
| Emissions (24h) | YB going to this gauge per 24h | |
| YB distributed | Lifetime YB minted to this gauge |
Gauge charts
Per-gauge time series: staked %, incentives weight (stacked area), votes (stacked), vote weight %, YB emissions (stacked bar), utilization, votes-per-YB. Initial day may be noisy and is filtered.
Tab: VeYB Revenue
Fee distribution to veYB holders.
Top metrics
| Label | What it is |
|---|---|
| veYB APR | Annualized % return based on current epoch distribution |
| $/veYB/year | Historical weighted average USD per veYB across all completed epochs |
| Total distributed | Cumulative USD distributed to veYB holders since genesis |
| Current epoch | USD distributed in the active epoch so far |
| Total veYB | Current veYB supply |
| Locked YB | Total YB locked in VotingEscrow |
| Pending admin fees | Fees collected but not yet claimed + distributed |
Fees claimed during an epoch are distributed evenly across the subsequent four epochs. This is why current-epoch numbers include tails from the prior four claim events.
Charts
- veYB APR (time series)
- Fee Distribution by Token (USD) — stacked bar, per-token value per epoch
- Fee Distribution by Token (Amounts) — same, raw token quantities (no USD conversion)
Epochs table
Per-epoch breakdown:
| Column | Meaning |
|---|---|
| Epoch | Epoch number; * = current, ** = ended |
| Epoch start | Start timestamp |
| veYB supply | Supply snapshot during epoch |
| YB price | YB/USD at epoch |
| Distribution (USD) | Total USD distributed |
| $/veYB/year | Annualized |
| VeYB APR | Annualized % |
"Estimates for future epochs are based on currently distributed fees, veYB supply, and the YB price, and do not constitute predictions of future distributions."
Claim action
The "Claim Fees" button executes a multicall: LT.withdraw_admin_fees on each market with pending fees, then FeeDistributor.fill_epochs. Admins and anyone can trigger; gas cost scales with number of markets with pending balances.
Tab: Locks
Lock-supply distribution.
Top metrics
| Label | What it is |
|---|---|
| veYB APR | Same as VeYB Revenue tab |
| Holders | Number of lock positions |
| Total veYB | veYB supply |
| Locked YB | YB locked in VotingEscrow |
| Permalocked YB | YB locked with infinite = True |
| % of eligible locked | Fraction of lockable YB supply that is locked |
| % of eligible permalocked | Fraction that is permalocked (no decay) |
Tooltip on % of eligible locked: "The percentage of the YB supply eligible for locking that is locked" — "eligible" excludes team/treasury YB subject to cliff vesting.
Charts
- % of eligible locked — two lines: locked (solid), permalocked (dashed)
- YB Locked — absolute quantities, same two series
- Lock time distribution — histogram of lock-end dates
Holders table
Ranked by veYB share, paginated at 100/page. Columns: rank, address (with ENS), locked YB, veYB share, lock end (or "Permalock").
Search by address or ENS.
Market detail page
Clicking a market opens /analytics/market/:ltAddress with per-market depth.
Market details
- Fundamental PPS —
pricePerShare() - Redemption PPS —
preview_withdraw(shares) / sharesfor a reference share count - Market TRD —
redemption / fundamental − 1(negative during a discount)
Pool details
- TVL — True USD TVL from oracle pricing
- Rebalance Reserve —
VP Reserve (fees) + Donations. The buffer Cryptoswap uses to absorbprice_scalerebalance cost. Higher = less LP drag during volatility. See Refueling and Donations. - Dynamic Fee — current Cryptoswap dynamic fee (rises with imbalance, falls when balanced)
Charts specific to market detail
- Plain PPS vs Watermark PPS — dual-axis: PPS (Fundamental) + Watermark PPS on left; asset price (USD) on right. Watermark PPS tracks
ideal_staked / staked_tokens. - Price Per Share (PLAIN) — Fundamental + Redemption for unstaked.
- Price Per Share (STAKED + EMISSIONS) — same for staked.
- Trading APY — window-selectable.
- Token APR — gauge APR for this market.
Pool state charts
Three side-by-side, exposing Cryptoswap internals:
- Virtual Price vs XCP Profit Half — Virtual price is "value of 1 LP token"; grows with fees, drops when
price_scalerebalances.xcp_profit_halfis 50% of lifetime profit and is a floor virtual price should not cross. The gap is the rebalance reserve. - Price Oracle vs Price Scale —
price_oracleis EMA of recent trade prices;price_scaleis where pool liquidity is concentrated. The pool rebalancesprice_scaletoward the oracle when conditions are met — this is the internal mechanism and is fee-funded, separate from user/arb swaps. - Donation Shares vs Available Shares — linear unlock of interest donations over the pool's donation window (default 7 days; governance-configurable per pool).
donation_shareslocked;available_sharesunlocked. Donations boost virtual price without diluting LPs.
Admin fees
Area chart of admin fees collected for this specific market. USD/asset-unit toggle.
Related
- Fundamental Value, Redemption Value, and TRD: the two share values and the transient gap between them.
- Watermark and Recovery: the staked-side drawdown mechanism in full.
- Gauges & Emissions: how gauge votes route emissions.
- Withdraw Liquidity: the full withdraw walkthrough.